Link indicator to form (calculate values from form)
Link indicator to a form or survey
- What is the purpose of linking an indicator to a form?
- How do you link an indicator to a form?
- How do we update the indicator's value?
- Example: Calculating a sum.
- Example: Calculating a Percentage (numerator/denominator)
- Example: Selecting a Unicity field
- Example: Disaggregated indicator
- Various examples
What is the purpose of linking an indicator to a form?
When an indicator is linked to a form, its value can be calculated based on the data contained in a custom form.
For instance, if the indicator is "% of participants satisfied with the training," and this information is available in a "training evaluation form," linking it to this form can be beneficial as LogAlto can calculate the indicator's value.
This helps to reduce the risk of errors that may occur when manually inputting the values into the indicator.
How to link an indicator to a form?
- Open the indicator configuration panel.
- Check the "Link to custom form" box.

- Select the form that contains the data to be used to calculate the indicator.
- Select a calculation method:
- Sum: This method will add all the records' values in the form.
- Percentage: This method calculates a rate for specific values in your form (see the example in a section below).
- Count: This method counts the number of records entered, regardless of value.
- Average: This method will take all the records and make an average of the values
- Select a *unicity field: select a field to ensure that certain items are unique and are not counted twice. This field is optional.
- If the calculation method is Sum or Average, Select a Value field.
- Other fields appear if your indicator is disaggregated, allowing you to match the form fields to your indicator categories.
- The filter can also be added (so that only records corresponding to the filters will be used in the calculation).
- Save the indicator form once the link has been configured.
Note on unicity: You may notice that form fields have "UID" added to their names. This means the uniqueness will be applied to the unique identifier of the value and not to the string (text) content. For example, two locations having the same name will have different unique identifiers (UID), and both will be included in the calculations.

To learn more how Analytics applies the distinct count click here.
How to update the indicator's value?
Once you have configured your indicator, if you want to update the indicator value:
- Open the logframe
- Click the “Data Entry” tab.
- When you click on the cell, a calculator icon will appear.

- When you click on the calculator icon, a window opens:

- You can use all the data or only those entered before a specific date.
- Finally, click on "Calculate and apply".
Calculation method `Sum` example
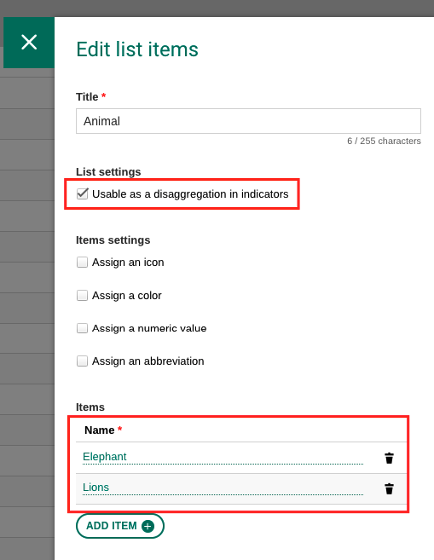
In our example, we will create a form called “Zoo,” in which we want to know how many elephants and lions are in each zoo and their gender.
- Create your form.

- Link the form you wish to disaggregate in the indicator setting panel. The checkbox to link the form will be at the bottom.


- In your custom form, you will need to make sure the data matches correctly to what is required for the indicator. Here the list used for the disaggregation and the form contains animal names. An other list will contain the labels for genders.
-
You must select the calculation method as sum (or average) to obtain your disaggregation.

Select the calculation method - Depending on how the form is structured, you will select between
DisaggregationandCategory


By category: allows the user to choose a calculation method and value field for each item/category, corresponding to the value in the customized form.
By disaggregation: allows the user to match the disaggregation with the form field. An example is gender. Users wish to check the list of gender systems in the custom form.

- Save the changes to the indicator.
- To update the values, go to data entry.

- In your indicator, you should see the selected disaggregation.

- Fill it out automatically by clicking on the calculator symbol. This will feed the indicator the data found in the form.

Example: percentage (numerator/denominator)
If you select "Percentage," you must specify the numerator and denominator.
The indicator value is then calculated as 100 x A/B (or 100 X Numerator/Denominator).
- A is the numerator (small group = those who meet the conditions)
- B is the denominator (larger group = all elements).
Example: the indicator is the percentage of female beneficiaries earning more than 200 USD annually.
- Calculation = 100 X Numerator/Denominator
- Numerator = female beneficiaries with annual income over 200 = 60
- Denominator = female beneficiaries = 300
- The indicator value is 100x(60/300) = 20%.
Example: unicity field
- 100 participants have attended three courses (=300 records in the participation form)
- 350 participants attended one course (=350 records in the participation form)
- 50 participants did not attend the course (=0 records in the attendance form)
- Suppose you want to count each participant who attended only once (=100+350=450). In this case, the unicity field is the "participant ID."
- OR if you want to count each attendance (=300+350=650). In this case, the unicity field is left empty.
Note: You may notice that some fields have (UID) attached to their name. This indicates that uniqueness is applied to the item’s automatically generated unique ID. Even if two items share the same name or string, they will still be treated as unique due to their distinct IDs.
Example: disaggregated indicator
The form is: Beneficiaries who participated in trainings
- In the project logframe, we click the pen icon next to the corresponding indicator.
- In the indicator's configuration panel, we make sure to disaggregate the indicator if necessary (in the example, we need to disaggregate by gender).
- Check the “Link to custom form” box.
- From the list of custom forms, we select the "Beneficiaries who participated in training" form.
Even though the Gender field is stored in the linked Beneficiaries individual sub-form, the system will automatically recognize and apply the gender disaggregation when calculating the indicator. Therefore, gender-disaggregated results will still be available in reports and dashboards.

Various examples
Here are some examples of the indicators supported by this link and how to configure them:
| Indicator example | Form | Calculation method | Field value | Categorization | Filter | Date filter |
| Total number of clinic visits per region | Visits | Count | N/A (count of records) | Region | N/A | All (no filter) |
| Average length of stay | Visits | Average | Length of visit | Region | N/A | All (no filter)visitation |
| Number of visits for dental issues (by gender) | Visits | Count | N/A (count of records) | Gender | Issue=dental | All (no filter) |
| Number of female patient visits in region A per age group | Visits | Count | N/A (count of records) | Age group | Gender=Female Region=region A | All (no filter) |
| Total number of doctors per region | Clinics | Sum | # of doctors | Region | N/A | All (no filter) |
| Total number of elephants and lions in a zoo per gender | Zoo | Sum | # of elephants and # of lions | Gender | N/A | All (no filter) |
If you would like further information or help to configure a specific form, please contact us at support@logalto.com, and we can review your data together.