Distinct values
Distinct values (1st occurence)
This article provides a comprehensive explanation of how to effectively utilize the distinct values feature. To further clarify this concept, the following examples will illustrate how the distinct count can be applied in practical scenarios.
The distinct count feature is labeled "Distinct value (1st occurence)" in the configuration panel for reports generated from the Analytics module.
- Explanation of the distinct count
- Example 1: on a single field
- Example 2: on two fields
- Example 3: for time-intelligence (indicator)
Explanation of the distinct value
The distinct value allows data to be filtered so that only one record is considered for each value of the selected columns.
When the Distinct values filter is applied, you must:
- Select columns (fields) that cannot appear more than once in the generated dataset.
- Specify a sort: Select the field from which data will be sorted and select a direction, ascending or descending. When there are two records or rows with the same value in the same column, the sort will determine which row (record) will be kept, since only the first record encountered will be kept.
- Specify a direction: Alternatively you can choose the sorting direction. Ascending mean it will sort from the smallest (or earliest) value to the biggest (or latest). Descending is the opposite.

Note: Distinct values apply the filter to the string content of the field. This is unlike the unicity option when linking forms to indicators, which applies the filter to the value's unique identifier. For example, with distinct values, if two locations have the same name, they will be counted once. With the form's unicity, the two locations have different IDs and will both be counted.
Example 1: distinct value on a single column (field)
Training courses and workshops are organized as part of a project. The organizers would like to know the last activity in which each participant took part.
The unfiltered datasets looks like this (3 participants took part in 2 activities each = 6 records)
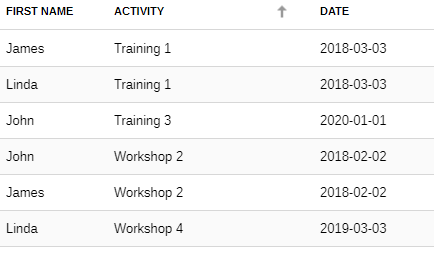
By applying the distinct values filter on the participant's name, it is possible to obtain a single record per participant. To find the most recent activity, you also need to sort by date (descending) to make sure you have the highest values (most recent date) first.

Once sorted, the data set now has only one row per participant = 3 records:

Example 2: distinct count on 2 columns (fields)
An existing project tracks the prices of various fruits over a period of time. We would like to determine the latest recorded price for each fruit, by year. As depicted in the table below, the prices of apples and bananas were recorded twice in 2020. Therefore, for the year 2020, it is necessary to filter the records in red and retain the most recent date, which is highlighted in blue.

If we filter only by fruit, we'll get a dataset with three records (one for each fruit). However, this only shows the most recent price recorded, whereas we want to find the most recent price recorded by fruit and by year. To achieve this, we need to select two columns in the filter: Fruit and Year. Furthermore, to ensure that we keep the last price recorded, we also need to sort by date.

As shown in the table below, only the last price for each Fruit + Year combination is retained in the new dataset.

Example 3: distinct values for time-intelligence (indicators)
We want to produce a line chart showing the progression of an indicator over time.Here are the indicator values:

In the Analytics module, we produce a bar chart that averages the actual values of the indicator, including the quarters on the X axis.

So far, it has not been necessary to use the distinct count since the indicator data was entered quarterly. However, if we wish to present them in years on the X axis, it is necessary to specify what we wish to display. Depending on the nature of the indicators, it is often more logical to present the average value of a certain period, while in other circumstances it is preferable to use the last value for the period.
If we don't use the distinct values filter and simply display the years on the X axis, we'll get a value of 30 for the year 2020 (average of 20, 25, and 45).
If we use the distinct values filter, putting the years on the X axis, we'll get a value of 45 for the year 2020 (last value recorded = 45).
