Indicator disaggregation
In this article, disaggregations and categorizations refer to the same concept.
LogAlto allows disaggregation of:
- The indicator's values
- The indicator's baseline
- The indicator's target(s)
Disaggregating an indicator means that the indicator value (and/or baseline/targets) is broken down into categories (example: Number of x by gender...by district...by age group).
This broken-down data can later be aggregated to obtain the overall indicator value.
In this article you will learn:
- When is it useful to disaggregate an indicator?
- How to configure disaggregation for an indicator with 1 disaggregation?
- How to configure disaggregations for an indicator with multiple disaggregations?
- How to enter disaggregated values for the baseline?
- How to enter disaggregated values for the target(s)?
- How to enter disaggregated actual values?
- Details of disaggregated indicators in a global logframe
- Remove disaggregations
When is it useful to disaggregate an indicator?
Disaggregating an indicator can help you to:
- Ensure that you are on track with certain requirements (i.e. inclusion and equality with regard to gender, race, etc.)
- Get more details on what makes up the indicator value.
- Notice "trends" or understand what influences the indicator's value.
Most users tend to "over-disaggregate". So keep these 3 questions in mind before deciding to disaggregate:
Is this useful?
Ask yourself:
- Will you use this information? Will you create analytics reports comparing the different categories? Will this influence your evaluation process?
- For this specific indicator, if you do not have baselines and targets for each disaggregation, is it really useful to know the disaggregated values?
Is this easy to do?
Collecting and entering data for each category may require more effort, or even be impossible, depending on the source or method of data collection.
Is the indicator's data entry table the only place where I can get this information?
If curiosity is the main reason for disaggregating the indicator, bear in mind that you may already be able to obtain the information elsewhere.
(Example: if the indicator is linked to data stored in the "Forms" module, you can aggregate the data from any of your form's field via the "Analytics" module.)
If you answer "Yes" to all 3 questions, then disaggregating the indicator is probably a great idea!
How to configure disaggregation for an indicator with only 1 disaggregation?
Step 1: Enable disaggregation for this indicator
- Open the indicator form (indicator configuration panel)
- Check the “Disaggregation” checkbox
Step 2: Specify the disaggregation method

Step 3: Specify how the overall value will be calculated on the basis of the disaggregated values
- If applicable, check the "Total is automatically calculated". This setting simply defines a "default" preference. But you can always calculate the value OR enter it manually.
- The box is checked: This means that you generally prefer to generate (calculate) the overall indicator value based on the values entered for each category.
- The box is not checked: This means that you choose to manually enter the overall indicator value.
- Select a calculation method: "Sum" or "Average".
- If you select Average, the overall indicator value will be the Average of disaggregated values (Example: % of children attending school. M=70%, F=40%. Overall=55%)
- If you select Sum, the overall indicator value will be the Sum of the disaggregated values (Example: Number of children attending school. M=1800, F=400. Overall=2200)
How to configure disaggregations for an indicator with multiple disaggregations?
Follow steps 1 to 3 as explained above.
During Step 2, select multiple disaggregation methods.
As soon as you select at least 2 disaggregations, another parameter will appear. "Combined categories" checkbox.
- If the box is checked: it means that you will enter values for each combination of items from disaggregation A with items from disaggregation B.
- If the box is not checked: it means that you will enter values separately for items from disaggregation A, then for each item from disaggregation B.


It is now possible to switch from combined to non-combined and vice versa, even if there are disaggregated values in the indicator. The system recalculates to place values in the correct categories if it becomes non-combined. If it becomes combined, it places the total in the N/A categories.
How to enter disaggregated values for the baseline?
An indicator's baseline is stored in LogAlto as the first indicator value.
Disaggregated values for the baseline must be entered through the data entry interface:
- Access the logframe
- Click
Data entry

- Click on the clock icon next to the indicator to open the indicator history panel.

- Click on the oldest value (which is the baseline value)

- You can now enter disaggregated baseline values:
- Enter a value for each category (or combination of categories).
- Either check the
Automatically calculatedcheckbox or enter the total manually. - Click "Set empty values to 0" if an empty cell means "0" (There's a difference between an empty actual value and 0. This also influences the overall value - sum or average.). Of course, you can also simply set 0 manually if required, but this button saves time if you have many categories to fill.
- Click
Done

Note that a baseline cannot be set for indicators that only allow entering the progress for each period (indicators that do not allow entering cumulative values) Read our article on editing indicators to learn more.
How to enter disaggregated values for the target(s)?
You can enter disaggregated targets using the indicator form (configuration panel) OR using the data entry grid:
Using the indicator form:
This can be done just after completing the 3 steps explained in the section " How to configure disaggregation for an indicator with only 1 disaggregation?" section.
If you are not currently configuring the indicator, you need to first open the indicator form (indicator configuration panel).
Once in the indicator form:
- Click
Add target

- A new target row will appear (by default, the target date is the project's end date).
- Click on the empty cell under
Target value.

- You can now enter disaggregated target values:
- Enter a value for each category (or combination of categories).
- Either check the "Automatically calculated" checkbox or enter the total manually.
- Click "Set empty values to 0" if an empty cell means "0" (There's a difference between an empty actual value and 0. This also influences the overall value - sum or average.). Of course, you can also simply set 0 manually if required, but this button saves time if you have many categories to fill.
- Click "Done".
Using the data entry grid:
If the indicator has already been configured, you can also enter disaggregated targets using the data entry grid:
Simply click on a "Target" cell in the grid. A panel will open, allowing you to enter a target for each category or combination.
(Of course, this is only possible if the indicator is disaggregated)

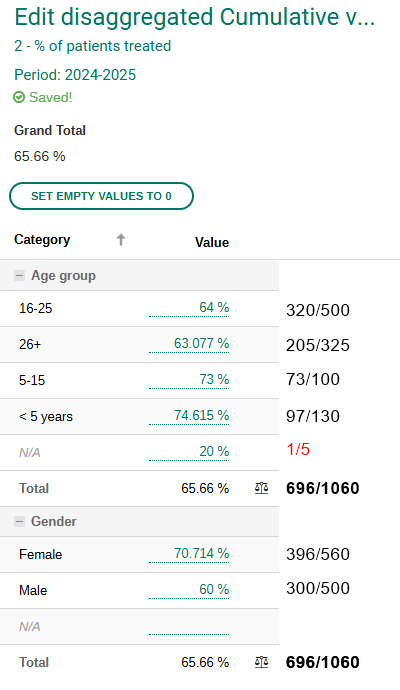
How to enter disaggregated actual values?
To enter disaggregated actual values:
- Access the logframe.
- Click "Data entry".
- IIn the data entry grid, click on a "cumulative" or "progress" cell on your indicator row. (The "Cumulative" cell means you are entering the overall figure for the indicator, and the "Progress" cell means you are entering the increase in the indicator since the last reporting period).
- A panel will open and allow you to enter disaggregated values
- Enter a value for each category (or combination of categories).
- Click "Set empty values to 0" if an empty cell actually (There's a difference between an empty actual value and 0. This also influences the overall value - sum or average.). Of course, you can also simply set 0 manually if required, but this button saves time if you have many categories to fill.
- Click
Done

|

|
If your disaggregated values do not match, click on the balance icon of the list to be used as reference by the other dimensions.

|

|
For indicators of the numerator/denominator type (rate), the N/A category will balance to the proper rate.
If the user closes the data entry window before doing that, a prompt will invite the user to balance the totals.

Details of disaggregated indicators in a global logframe
Disaggregation by project
Corporate indicators in the global logframe are automatically disaggregated by project.
Other disaggregations
Corporate indicators in the global logframe can have additional disaggregations.
However, please note that if you add disaggregations to corporate indicators, projects will not be able to remove those disaggregations, although categories can still be removed.
Remove disaggregations
It is now possible to delete a disaggregation or remove a single category even if values are present.

A pop-up message will warn you that that the indicator has values and ask you to confirm whether you want to delete it.

When the indicator comes from the global logframe, it is only possible to remove categories.
